DevOps & SRE
Network Traffic Visualization Data Pipeline
A real-time observability pipeline for capturing, streaming, transforming, storing, and visualizing network traffic data.
Open projectAbstract
This project investigates how a decoupled data pipeline can provide real-time visibility into network behavior.
The system captures raw packets from a network interface, streams them through Kafka, transforms them into structured traffic records, stores them in PostgreSQL, and visualizes operational metrics in Power BI. The goal was to model a production-style observability workflow using modular, replaceable components.
Problem
Raw network traffic is difficult to inspect directly because packet-level data is continuous, noisy, and hard to query over time. A useful monitoring system needs to separate ingestion, processing, storage, and visualization so each stage can scale independently while preserving the ability to analyze historical traffic.
Pipeline Architecture
The pipeline is composed of four decoupled stages, each handling a distinct concern in the data flow:
Capture
A Python agent using the Scapy library performs low-level packet capture directly off the network interface, producing a continuous stream of raw traffic events.
Stream
Captured packets are published to a Kafka topic via a producer, decoupling ingestion from processing and providing a durable, replayable buffer. This stage ensures backpressure resilience and supports multiple downstream consumers.
Transform & Store
A Kafka consumer reads from the topic, extracts structured fields such as source/destination hosts, protocols, GeoIP metadata, and packet sizes, then writes the normalized records into PostgreSQL. The schema is optimized for time-series aggregation queries used by the reporting layer.
Visualize
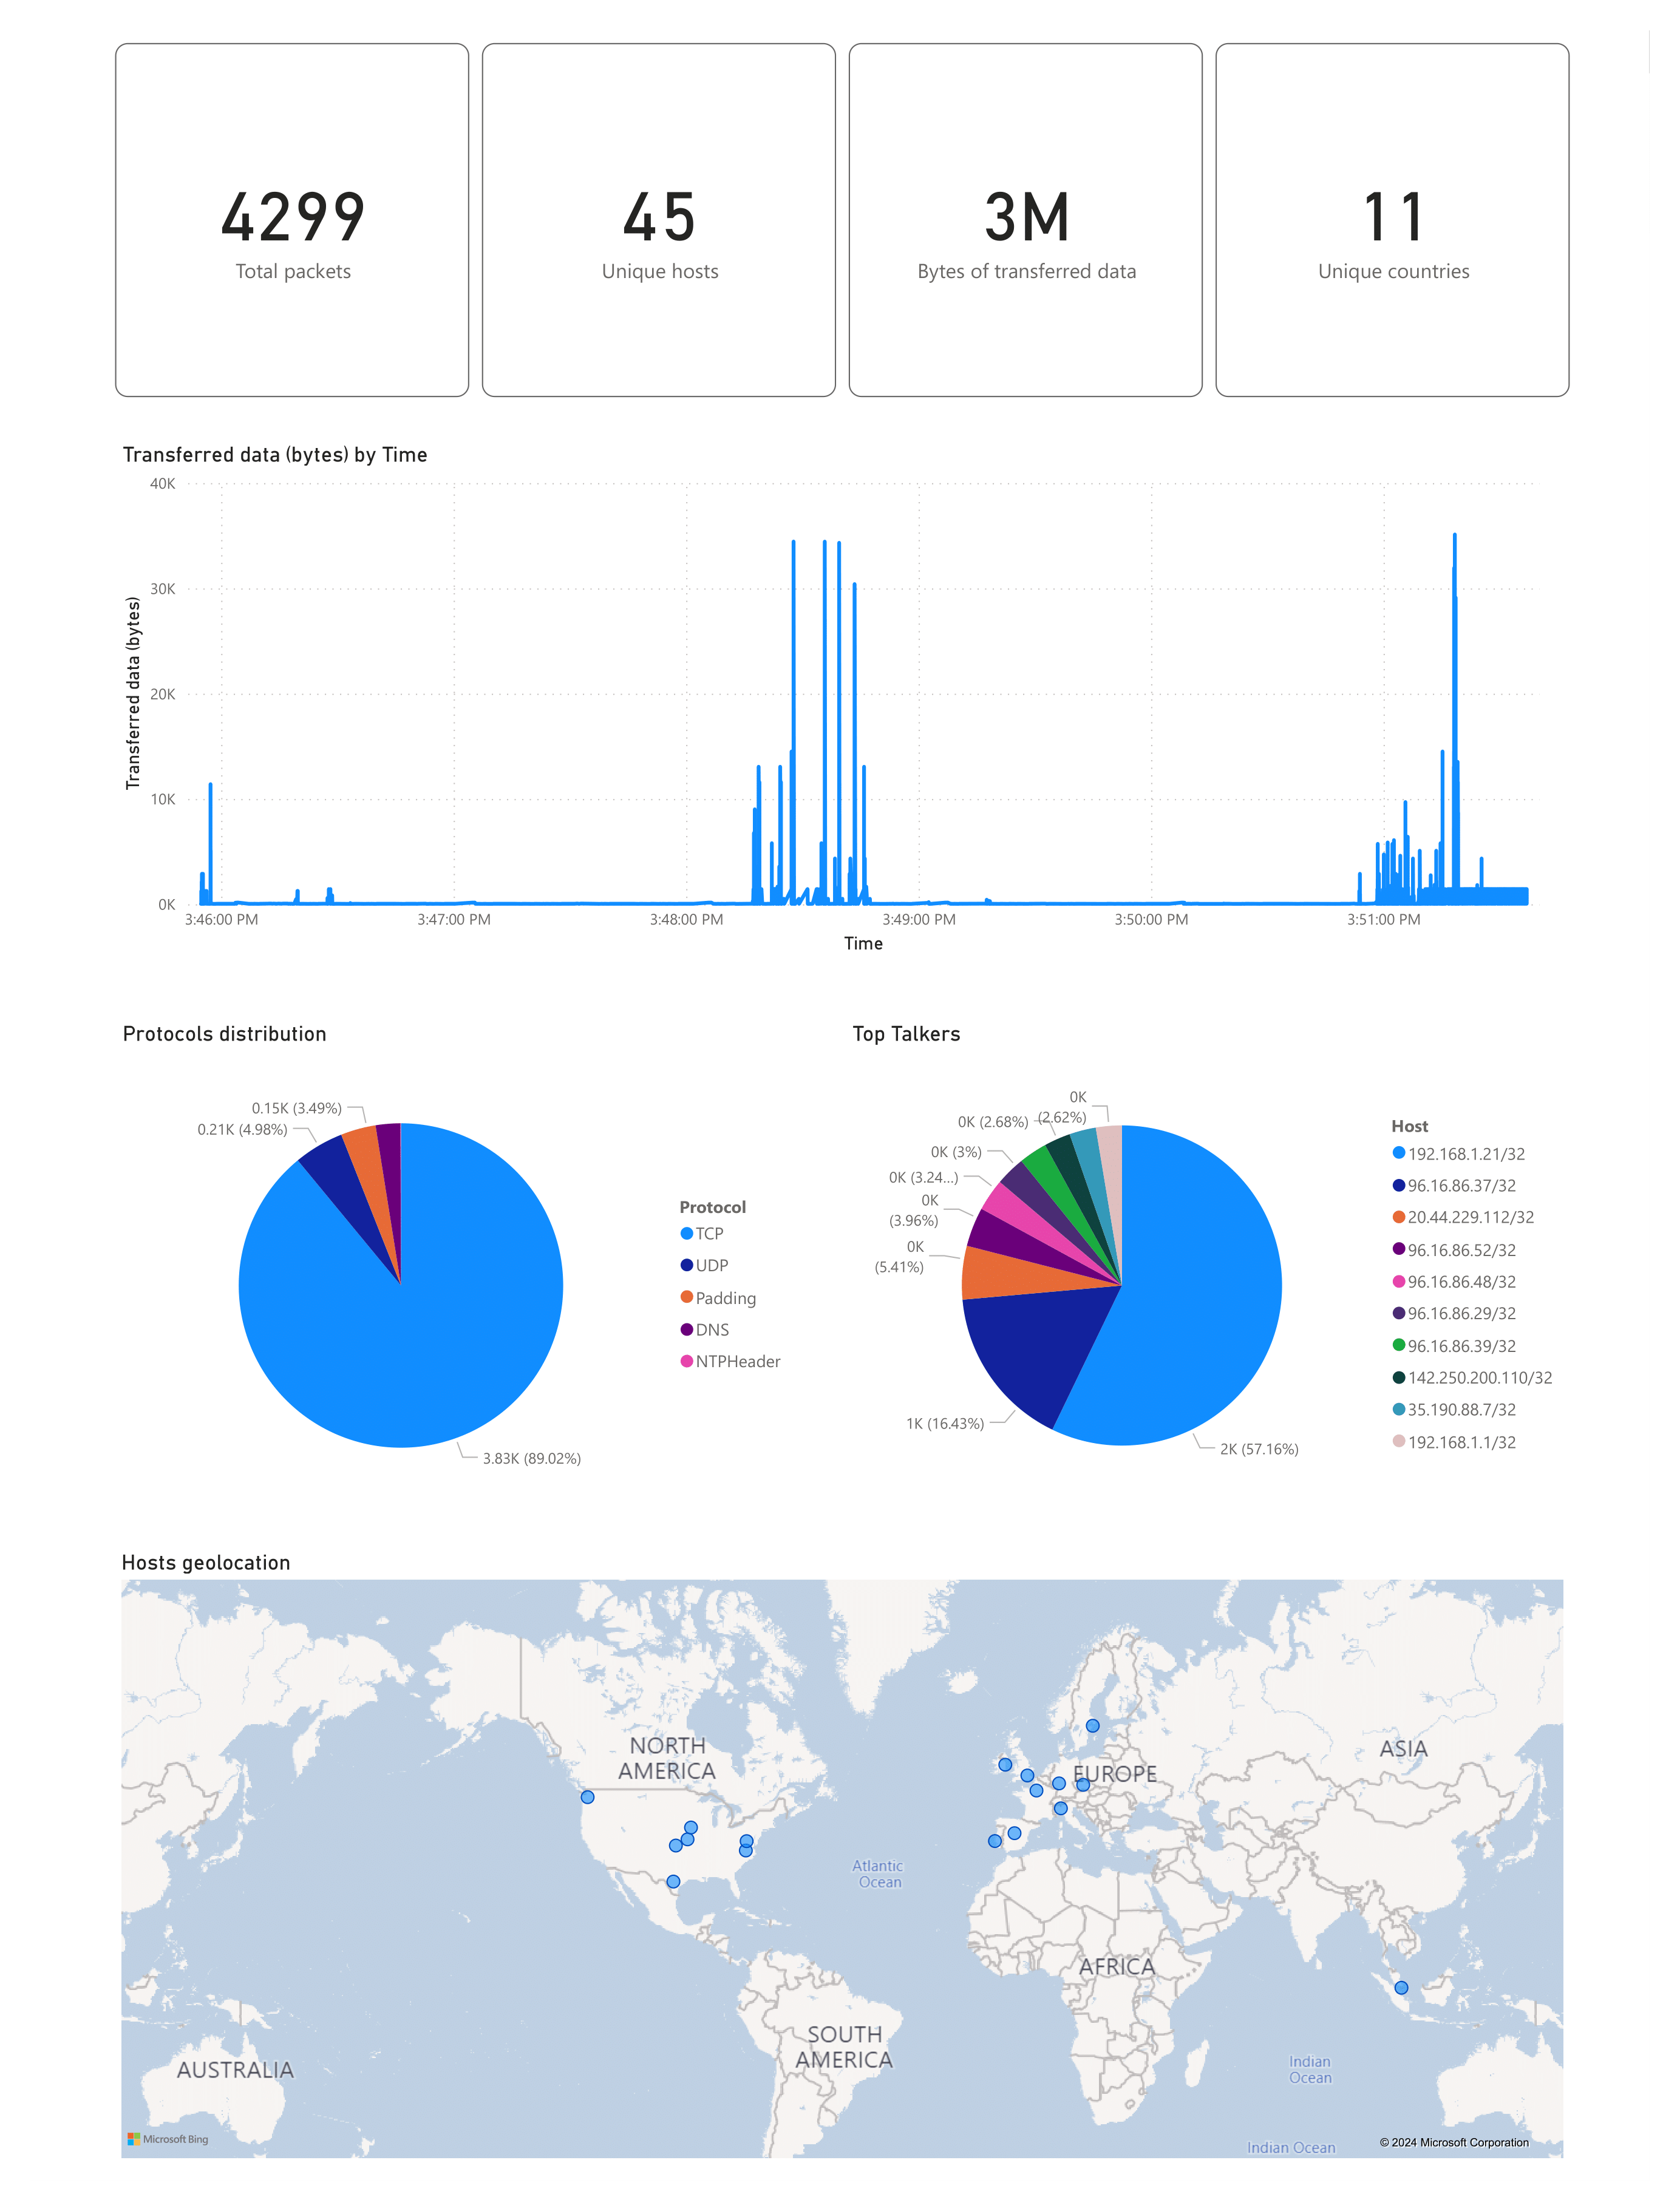
Power BI connects directly to PostgreSQL to surface a live operational dashboard tracking key traffic metrics: packet rates, unique hosts, protocol distribution, transferred data volume, and geographic origin of traffic.
The Pipeline

Evaluation
The Power BI report provides operators with real-time visibility into:
- Total packets captured and throughput trends
- Unique hosts communicating on the network
- GeoIP mapping of traffic origins
- Protocol distribution breakdown
- Aggregate data transfer volumes
Outcome
The project is a complete monitoring pipeline built from open-source and analytics tools. By decoupling collection, streaming, transformation, storage, and reporting, the system supports replayable ingestion, structured querying, and dashboard-level operational insight into network activity.