
This project focuses on creating a comprehensive data pipeline for capturing, streaming, transforming, storing, and visualizing network traffic data.
By leveraging technologies such as Python, Kafka, PostgreSQL, and Power BI, the goal is to provide a seamless solution for analyzing and monitoring network traffic patterns.
Overview
The project is structured around the following key components:
Data Collection
Using a Python script, the project captures network traffic data using the Scapy library, enabling precise and detailed packet capture.
Data Streaming
Captured data is streamed to a Kafka topic using a Kafka producer within the Python script. This step acts as a buffer for incoming data, ensuring a continuous flow for analysis.
Data Transformation
A Kafka consumer consumes data from the Kafka topic, extracting relevant information such as packets, unique hosts, geoip information, etc., and transforms the data as required for further processing.
Data Storage
Transformed data is stored in a PostgreSQL database. PostgreSQL offers a reliable and scalable solution for storing network traffic data, ensuring data integrity and accessibility.
Data Visualization
Power BI is used to connect to the PostgreSQL database, enabling the creation of visualizations and dashboards based on calculated traffic metrics. This feature facilitates easy monitoring and analysis of network traffic patterns, aiding in identifying potential issues or anomalies.
The Pipeline

As mentioned above, the data pipeline consists of several stages, each serving a specific purpose in the overall process. The pipeline starts with data collection, followed by streaming, transformation, storage, and visualization.
This structured approach ensures that network traffic data is efficiently captured, processed, and presented in a meaningful way.
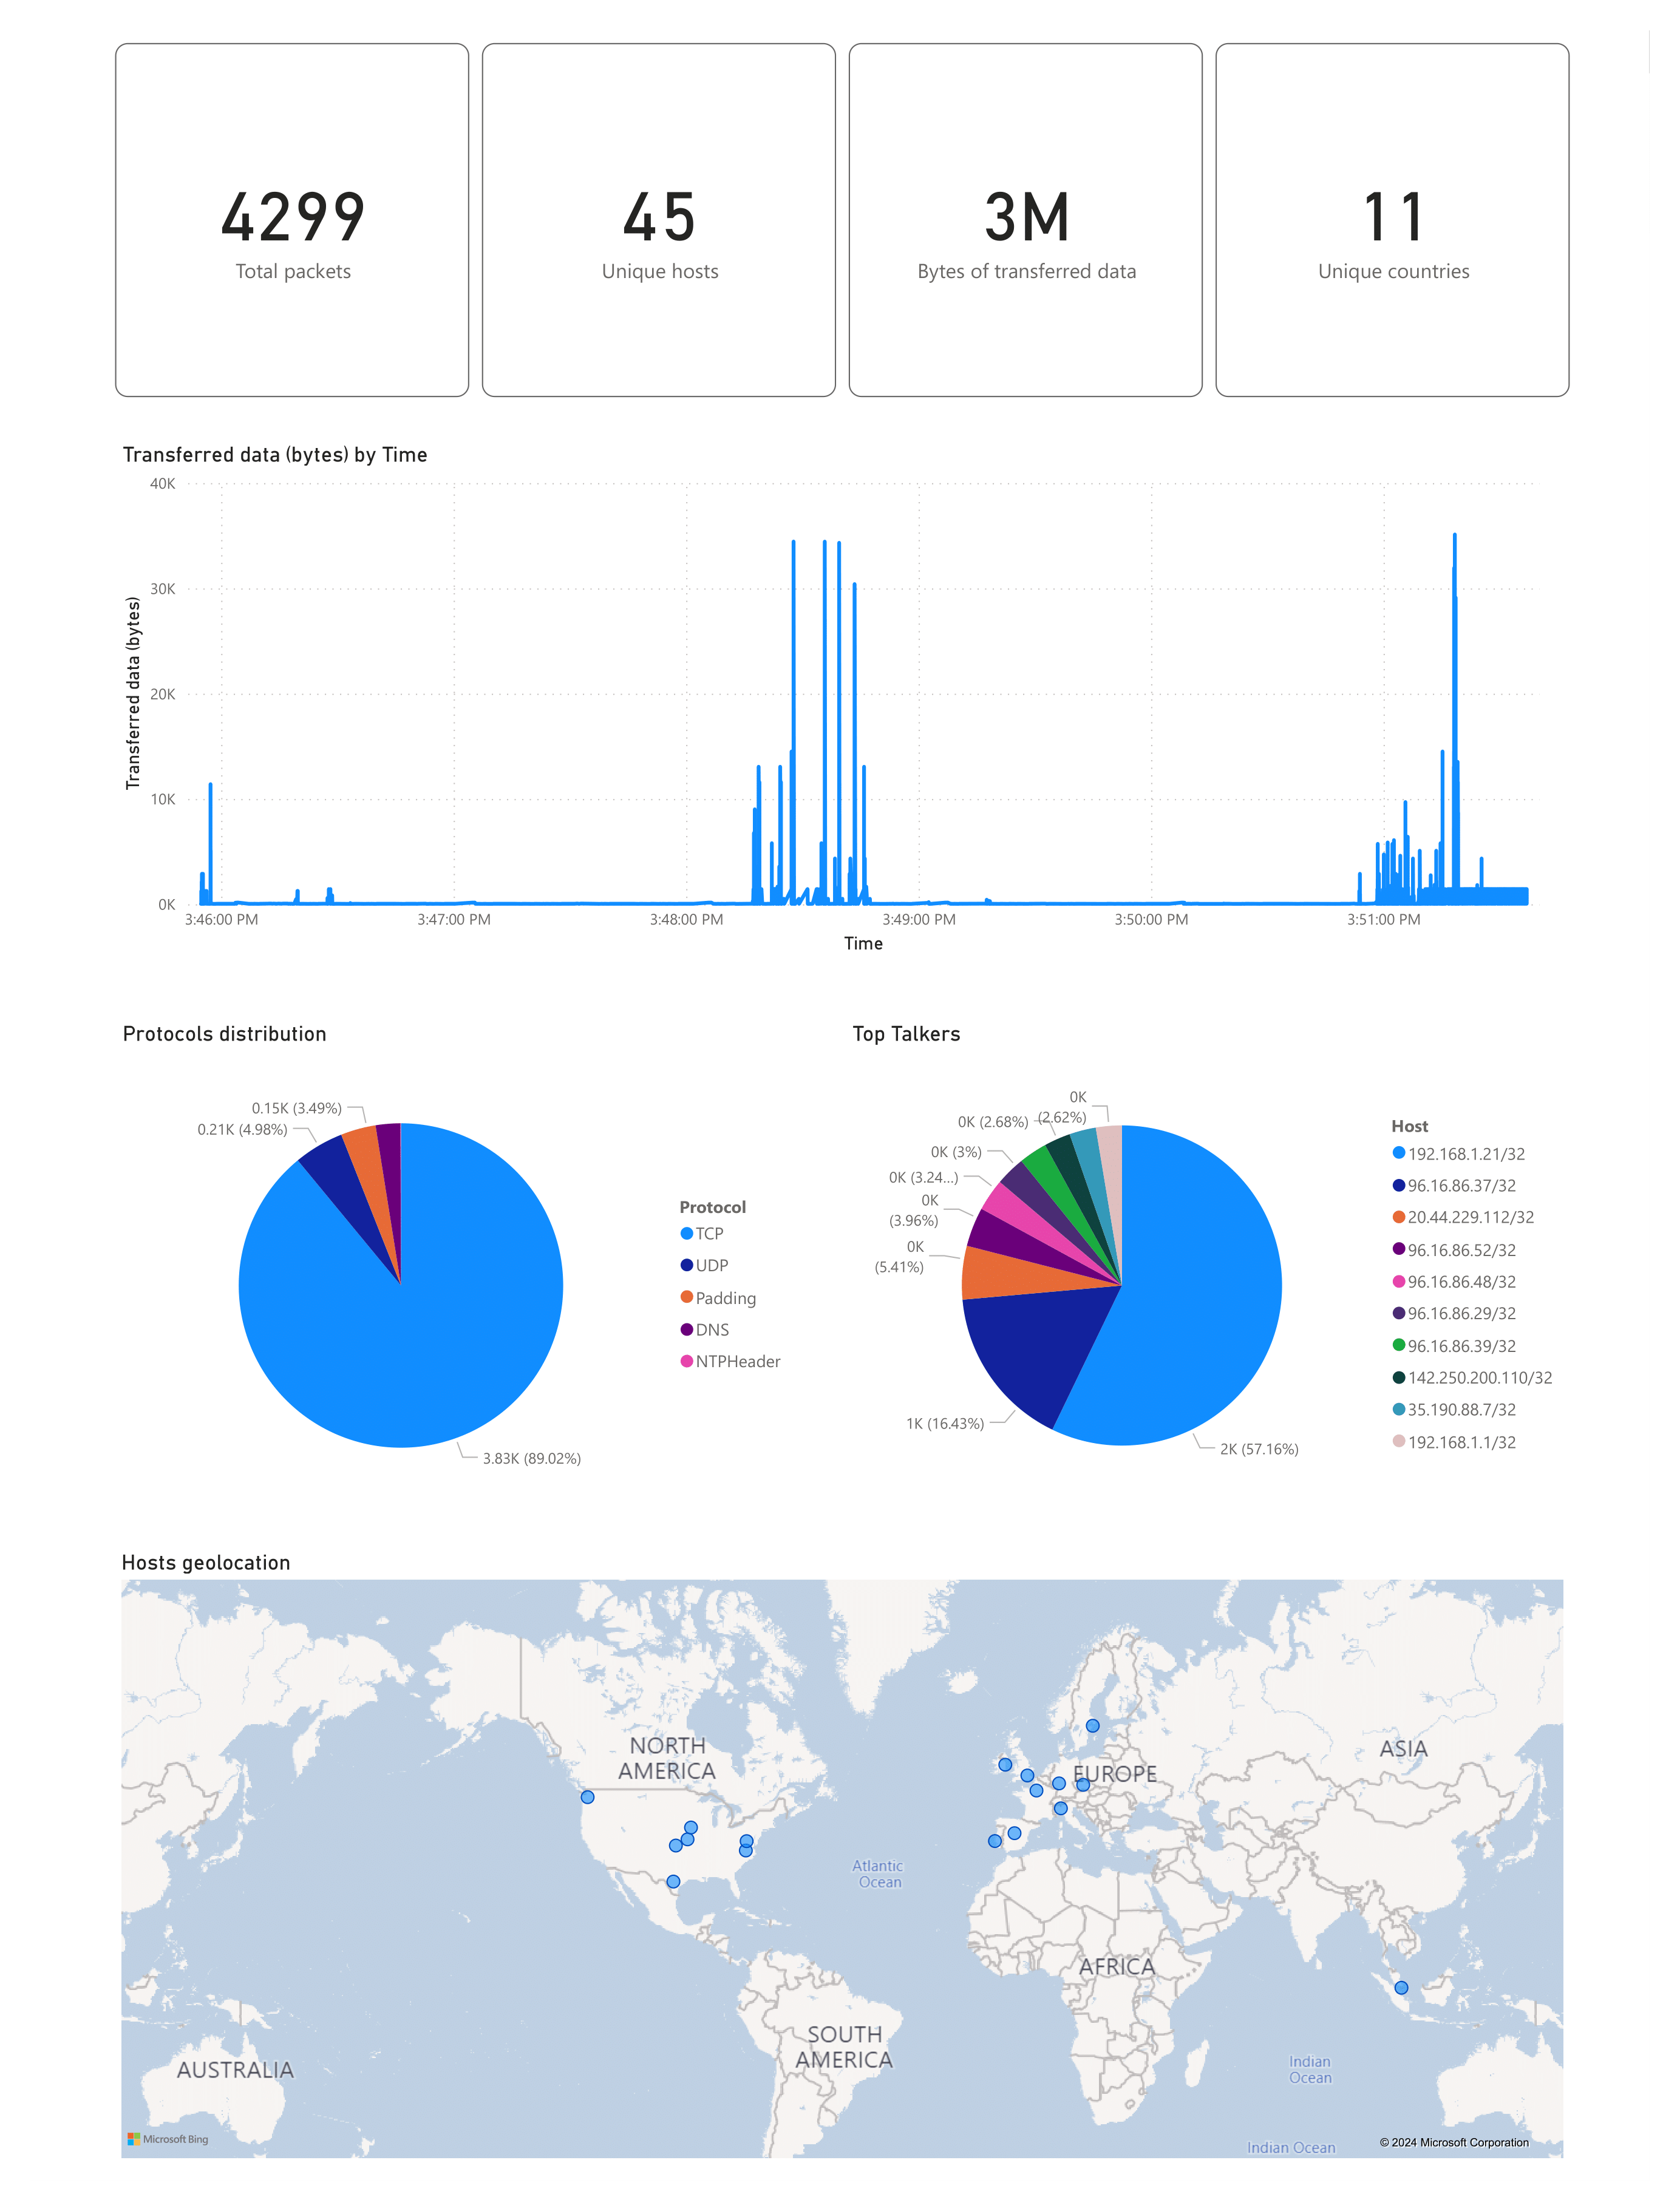
The report
The report is a Power BI dashboard that provides insights into network traffic patterns, including:
- Total packets captured
- Unique hosts
- GeoIP information
- Protocols distribution
- Transferred data volume
Conclusion
This project marks the first data pipeline I've worked on, it has not only deepened my understanding of data pipelines but has also given me a sense of accomplishment in building a practical and impactful solution for network traffic analysis.
Have a nice day ^_^